LLM observability is runtime visibility into the prompts, responses, tokens, traces, and evaluator scores your model produces in production, so you can catch silent failures, control cost, and debug agent runs before customers notice. It borrows the traces, metrics, and logs vocabulary of traditional monitoring but adds signals specific to language models, such as time to first token, token burn, and faithfulness scores that can help flag hallucinations.
The single biggest reason to build this now: a wrong-but-fluent answer produces no error code. Nothing crashes. Your uptime dashboard stays green while the model quietly tells customers something false. Standards like OpenTelemetry are becoming the backbone for capturing this data, and tekRESCUE, an AI partner working with businesses on risk-aware AI adoption, treats this instrumentation as a prerequisite, not an afterthought, for any serious deployment.
What you actually need to track from day one:
- Every prompt paired with its completion, not one without the other
- TTFT at multiple latency percentiles, not just an average
- Cost per successful outcome, not just cost per request
- A trace per request that shows every model call, tool call, and retrieval step
Key Takeaways
LLM observability works because it replaces guesswork about model behavior with traces, metrics, and logs that make silent failures and cost overruns visible before customers report them.
| Point | Details |
|---|---|
| Pair prompts with completions | Never log a response without the prompt that produced it, or debugging becomes guesswork. |
| Track TTFT at p99, not average | Averages hide the latency tail where your worst user experiences actually live. |
| Watch faithfulness alongside retrieval precision | A drop in retrieval precision often predicts a hallucination spike a day or two later. |
| Pin your OpenTelemetry schema version | GenAI semantic conventions are still in Development and attribute names can shift. |
| Bring in tekRESCUE for the risk mapping | tekRESCUE’s AI Profit and Growth Assessment aligns observability instrumentation with actual security and business risk. |
Table of Contents
- What Is LLM Observability, and Why Doesn’t APM Cover It?
- The Failure Modes Traditional Monitoring Never Catches
- Which Metrics Actually Belong on Your Dashboard?
- How Do You Instrument This Without Rebuilding Everything?
- RAG Observability: Catching Retrieval Decay Before Users Do
- An Eight-Week Path From Zero to Production-Ready
- The tekRESCUE AI View on Turning Signals Into Strategy
- Handling the Data You’re Now Collecting
- What Engineers Get Wrong About Instrumenting LLMs
- Get a Clear Read on Your AI Risk Before You Scale It
- Sources
What Is LLM Observability, and Why Doesn’t APM Cover It?
LLM observability means inferring what’s happening inside a model system by watching what goes in and what comes out, since you can’t inspect the weights directly. That inference runs on three pillars: traces, metrics, and logs. Each answers a different question, and skipping one leaves a blind spot the other two can’t cover.
Traces are the span tree for a single request. When an agent calls a model, then calls a tool, then calls the model again to interpret the tool’s output, a trace captures that whole nested sequence with latency and cost attached to each step. Traces record every model call, tool call, and retrieval with inputs, outputs, tokens, latency, and cost, which is what makes agent debugging possible when a run behaves unpredictably. Without a trace, you’re staring at a final answer with no idea which of five steps produced the error.
Metrics are the aggregates: average TTFT over the last hour, tokens consumed per day, error rate by model version. They’re what you graph and alert on.
Logs are the ground truth: the actual prompt and the actual response, stored together. A log without its paired prompt is close to useless for debugging, because you can’t tell if a bad answer came from a bad question or a bad model.
Here’s why application performance monitoring tools fall short:
- APM tracks whether a service responded, not whether the response was true.
- APM has no concept of a hallucination or a faithfulness score.
- APM wasn’t built to correlate token spend with business outcomes.
- APM can’t tell you that your retrieval step returned stale documents from three months ago.
LLM observability captures structured signals such as prompt and completion pairs, token consumption, and latency stages precisely because generic monitoring was never designed to evaluate correctness. A request can return 200 OK and still be wrong.
Pro Tip: Store prompts and completions as a single linked record from day one. Retrofitting that pairing after a production incident, when you’re trying to reconstruct what the model actually saw, is one of the most common regrets teams report.
The Failure Modes Traditional Monitoring Never Catches
Most production incidents in LLM systems don’t look like incidents. They look like normal traffic with degraded quality, which is exactly why they slip past dashboards built for uptime.
Silent failures are the core problem. The model returns a confident, well-formatted, wrong answer. No exception fires. No latency spike occurs. Your on-call engineer sees nothing because there’s nothing to see unless you’re scoring outputs for faithfulness.
Prompt drift happens when someone edits a system prompt in a config file, ships it, and three days later notices support tickets climbing. Without version control and provenance tracking on prompts, you can’t correlate the quality drop with the change that caused it.
Orchestration latency is frequently misattributed to the model itself. Latency problems users experience often originate in the orchestration layer, meaning sequential tool calls or a slow retrieval step, not the inference call. Teams that only instrument the model call miss this entirely and spend days optimizing the wrong component.
RAG-specific decay shows up as stale sources feeding the model outdated facts, or context stuffing, where you cram so many retrieved chunks into the prompt that the model loses track of what’s actually relevant. Retrieval precision drops quietly, and faithfulness follows it down.
What these four failure modes share:
- None trigger a traditional error or exception
- All are detectable only through domain-specific scoring, not standard uptime checks
- All compound over days or weeks rather than announcing themselves instantly
- All require a trace or a log to diagnose after the fact, not just a metric
Post-deployment monitoring convenings organized by NIST and CAISI grouped this territory into six categories: functionality, operational, human factors, security, compliance, and large-scale impacts, and found that validated monitoring practices across most of them are still nascent. That’s a candid admission from a standards body: the tooling and playbooks for catching these failures are still catching up to the risk.
Which Metrics Actually Belong on Your Dashboard?
Not every metric earns a spot. The ones below are the ones that catch real production problems, and each has a rough threshold worth starting from.
Time to first token is the latency users actually feel while a response streams in, distinct from total generation time. Measure it at p50, p95, and p99, because an average hides the tail where your angriest users live. A p99 latency significantly higher than p50 may indicate intermittent issues upstream, such as delays in retrieval calls or queuing.
Token and cost metrics matter more as spend scales. Tracking tokens per request tells you if prompts are bloating over time. Daily token burn catches runaway loops in agent systems before the invoice does. Cost per successful outcome, not just cost per request, is the number that actually maps to business value, since a cheap request that fails helps nobody.
Quality metrics are the ones most teams skip and regret skipping. Faithfulness or hallucination rate, scored against retrieved context or ground truth, is the closest thing to a correctness signal you’ll get. Refusal rate and user feedback (thumbs up or down, if you collect it) round this out.
Operational metrics cover tool-call success rate, trajectory length in agent loops, and version tags for both the model and the prompt so you can slice every other metric by “what changed.”
| Metric | What it measures | Starting alert threshold |
|---|---|---|
| TTFT (p99) | Time until the first streamed token arrives | Alert on 2x the p99 rolling latency |
| Cost per successful outcome | Total spend divided by requests that met a quality bar | Alert on 3x cost-per-session outliers |
| Faithfulness rate | Share of responses grounded in provided context | Alert below 90% on sampled evaluation |
| Tool-call success rate | Percentage of agent tool invocations that complete without error | Alert below 95% |
| Tokens per request | Average and p95 token count per completion | Alert on sustained 30% week-over-week growth |
A 20-metric production checklist groups these into performance, cost economics, quality, safety, and operational reliability, and assigns rough ownership per metric, which is worth borrowing if you’re standing up a dashboard from scratch. The point isn’t to track all twenty on day one. It’s to know which five actually predict a bad week.
- Tag every metric with model version and prompt version, or slicing by “what changed” becomes guesswork
- Sample faithfulness scores; scoring every single response with an evaluator model gets expensive fast
- Watch tokens-per-second, not just total latency, since hosted providers occasionally rebalance capacity in ways that quietly slow throughput without an outage
How Do You Instrument This Without Rebuilding Everything?
Three patterns cover most of what you need, and you can adopt them in order of increasing effort.
- Minimal input/output capture. Log every prompt and completion pair, plus token counts and latency, wrapped around your existing model calls. This is the lowest-effort starting point and already catches a surprising share of quality regressions.
- Per-request spans for agent loops. Once you have anything resembling an agent, tool calls, retrieval steps, multi-turn reasoning, you need a trace, not just a log line. Traces are the signal that makes debugging non-deterministic agent runs possible, because they preserve the execution path, not just the final output.
- Evaluator score emission. Run a small set of automated evaluators (faithfulness, relevance, toxicity) and emit their scores as metrics you can graph and alert on, the same way you’d graph latency.
OpenTelemetry’s GenAI semantic conventions give you a standard vocabulary for span names and attributes across model calls, but the conventions are still marked Development, meaning attribute names have shifted before and will likely shift again. Pin your schema version explicitly rather than tracking the latest spec, or a routine library update can silently break your dashboards.
For Python and Node teams, the practical starting point is usually an import-swap: replace your raw model SDK call with an instrumented wrapper (from an OpenTelemetry-compatible library or a tool built for this specifically) that automatically emits spans, token counts, and latency without you writing manual instrumentation for every call site. You add real code only where you need custom attributes, like a user ID or a RAG source tag.
On self-hosting versus hosted backends: a self-hosted GenAI observability stack integrates with your existing OpenTelemetry collector pipeline and avoids per-trace pricing, but you own the storage growth and the operational upkeep. Hosted backends remove that operational burden in exchange for a bill that scales with trace volume. Comparing Langfuse vs. Helicone is really a proxy for this decision: Langfuse leans toward the self-hosted, open-source end with strong tracing and cost visibility built in, while managed options trade setup effort for predictable per-trace billing. A practical engineer’s guide to LLM observability recommends starting with self-hosted Langfuse specifically because it gets you tracing and cost visibility fast without a procurement cycle.
Pro Tip: Start with the import-swap pattern on your highest-traffic endpoint first, not your most complex one. You’ll learn more from watching real production volume than from perfectly instrumenting a low-traffic edge case.
RAG Observability: Catching Retrieval Decay Before Users Do
Retrieval-augmented generation adds a whole second failure surface on top of the model itself, and generic LLM metrics won’t catch it. You need retrieval-specific signals or you’re flying blind on half the system.
Context precision measures how much of what you retrieved was actually relevant to the query. Context recall measures whether you retrieved everything relevant that existed in your source data. A practical guide to RAG metrics recommends alerting when either drops meaningfully below its baseline, since a sustained dip usually means your index is stale, your embedding model changed, or your chunking strategy stopped matching how documents actually get written.
Faithfulness scoring checks whether the generated answer is actually grounded in the retrieved context, rather than the model filling gaps with plausible-sounding invention. Score a sample of production traffic automatically, then route the lowest-scoring responses to human review rather than trying to review everything, which doesn’t scale past a handful of requests a day.
The correlation worth watching closely: retrieval precision drops and hallucination rate increases tend to move together, and often the retrieval drop happens first by a day or two. If you’re only watching faithfulness scores, you’ll see the symptom without the cause. Watching both together turns a mystery into a fix: reindex, adjust chunk size, or refresh a stale source.
- Sample retrieved chunks alongside the final answer so a human reviewer can see exactly what the model was given
- Tag retrieval results with document freshness so stale-source problems show up as a pattern, not a one-off complaint
- Set retrieval precision alert thresholds relative to a rolling baseline rather than fixed values, as normal behavior varies across domains.
Context stuffing, cramming more retrieved chunks into the prompt hoping more context helps, is best caught by retrieval precision checks and sampled evaluator scores tied to specific retrieved chunks, not by watching latency or cost alone. More chunks often means slower and more expensive, with no faithfulness improvement to show for it.
An Eight-Week Path From Zero to Production-Ready
You don’t need every metric on day one. You need the right five in the first month and a habit of expanding from there.
- Week 1 to 2: Instrument prompt and completion capture on your highest-traffic path. Pair every prompt with its response in a single stored record.
- Week 2 to 4: Stand up a small set of evaluators in shadow mode, scoring traffic without blocking anything, so you build a faithfulness baseline before you need to act on it.
- Week 4 to 6: Move prompts out of scattered config files and into version control with a review process, the same way you’d treat any other production code change.
- Week 6 to 8: Wire up your top five alerts and confirm each one links straight to the trace that triggered it.
Those five alerts, in priority order: p99 latency spiking against a rolling seven-day average, cost-per-session running three times above baseline, faithfulness score dropping on sampled evaluation, error rate climbing on any single model or prompt version, and a traffic anomaly that doesn’t match your usual daily pattern. Rolling-window, segment-aware alert rules catch real problems far better than fixed absolute thresholds, since LLM traffic and cost both swing naturally by time of day and day of week.
The operational bar worth holding yourself to: when an alert fires, someone should reach the actual trace behind it in under 30 seconds. If your alert says “faithfulness dropped” but doesn’t link to the specific requests that caused it, you’ve built a notification system, not an observability system.
The tekRESCUE AI View on Turning Signals Into Strategy
Instrumenting traces and metrics tells you what’s breaking. It doesn’t tell you which fixes actually move revenue, or where a quick patch creates a security gap you’ll regret in six months. That’s the gap tekRESCUE’s AI Profit and Growth Assessment is built to close: it maps your existing AI usage, including the observability blind spots most teams don’t know they have, against actual business outcomes.
Where this matters most in practice:
- Scoping which metrics tie to revenue or retention before you build dashboards nobody looks at
- Integrating cybersecurity review into observability rollout, since logging every prompt and completion creates a new data-handling surface
- Deciding, with a team that’s seen this across construction, professional services, and nonprofit deployments, whether to build in-house or bring in help for the parts that touch compliance
Teams tend to ask an AI partner for exactly this: not to write the instrumentation code, but to make sure the roadmap for observability lines up with where the actual operational risk sits.
Handling the Data You’re Now Collecting
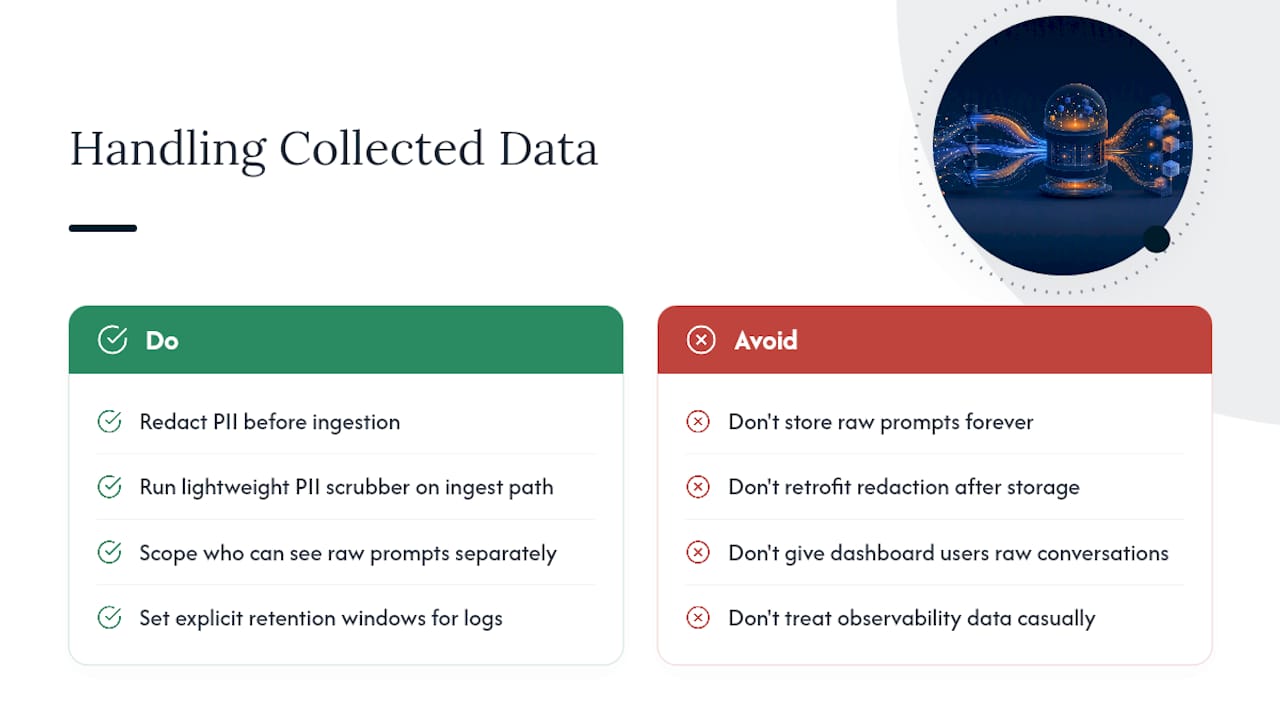
Capturing prompts and completions means you’re now storing whatever users put into those prompts, which can include names, account details, medical information, or anything else someone typed into a chat window. That data needs the same handling discipline as any other sensitive log, and treating it casually because it’s “just for debugging” is how breaches happen.
Redact or mask personally identifiable information before it lands in your observability backend, not after. Retrofitting redaction on data that’s already stored defeats the purpose. Some teams run a lightweight PII scrubber on the ingestion path specifically so raw logs never contain a name or account number in the first place.
Access control matters as much for observability data as for production databases. A trace that shows a customer’s full conversation history is exactly the kind of record that shouldn’t be readable by anyone who happens to have dashboard access. Scope who can see raw prompt and completion content separately from who can see aggregate metrics.
Retention policy deserves an explicit decision, not a default. Keeping every prompt and response forever is rarely necessary and expands your exposure if that backend is ever compromised. Decide how long you actually need raw logs for debugging versus how long aggregated metrics need to live, and set different retention windows for each.
If you operate in a regulated industry, your observability pipeline is now part of your compliance surface, not a side project. The same standards conversation NIST and CAISI convened around post-deployment monitoring extends naturally into data handling: visibility into model behavior and responsible handling of the data that visibility requires aren’t separate problems.
What Engineers Get Wrong About Instrumenting LLMs
The most common mistake I see is logging completions without the prompts that produced them. Six months later, nobody can tell you why the model said what it said, because half the record is gone. Store them as one linked object from the start, or don’t bother logging at all.
The second mistake is treating prompts as throwaway strings scattered across a codebase instead of versioned artifacts. Put them in version control with a review process. You’ll thank yourself the first time a prompt change causes a quality regression and you need to know exactly what changed and when.
Evaluators and human review loops should come earlier than most roadmaps put them. Waiting until you have a “real” quality problem to build evaluation means you’re building it under pressure, with no baseline to compare against.
— Randy Bryan
Get a Clear Read on Your AI Risk Before You Scale It
Building the dashboards is only half the job. The harder question is whether what you’re instrumenting actually matches where your business is exposed, and most engineering teams don’t have a clean way to answer that without pulling in outside eyes. tekRESCUE is built for exactly that gap: instead of a generic security audit or a bolt-on monitoring tool, tekRESCUE AI’s Risk Assessment maps your specific AI usage, observability gaps included, against real operational and security risk, then hands you a roadmap instead of a report you’ll never act on.
That roadmap addresses the actual efficiency and potential vulnerability AI creates in your business context, regardless of industry. If you want a clear picture of where your LLM systems stand today, book the AI Profit and Growth Assessment and get a roadmap built around your actual setup, not a generic checklist.
Sources
- Post-deployment monitoring workshops and literature review (NIST/CAISI report)
- LLM observability: Tracing & monitoring agents (AI Architecture blog)